The histogram is that graph that accompanies your image. It tells you a lot about not only about the exposure, but also the contrast of your photograph. Knowing how it works can help you improve your photography, and it’s not a difficult thing to learn.
Contrary to the title of that book, for most photographic purposes there are 256 shades of gray. Why 256? Well, that has got to do with how computers work, and the binary system. I’m not going into that fully here. The important thing is that in photography we want to see a smooth transition from black to white 256 shades are sufficient for the human eye to be unable to differentiate between those adjacent grays.
Histograms are bar graphs that plot the number of pixels of each shade of gray, or tone. The columns represent the number of pixels appearing in each tone of the photo. On the left is black, on the right is white, and mid-gray is in the middle. So, if we had an image that was just half dark gray and half light-gray, we would see two single columns of equal height towards either end of the histogram. They are each just one column wide because the corresponding block in the picture is one shade of gray. The columns have the same height because the area of each block is identical.
If we now add a larger area of mid-gray to the picture, then the new peak in the middle of the histogram corresponds with that. It’s taller than the other two peaks because it represents a bigger area of the picture.
If we place a gradient diagonally across the picture, from black to white, you will see all the tones have pixels allocated to them, and so all the columns in the histogram are filled, though some more than others.
Of course, a more complex picture will have a less uniform histogram.
What Should My Histogram Look Like?
This is one question I am often asked. The answer is this, there is no perfect histogram. It just tells you how different shades appear in your images. However, a histogram showing all the pixels pushed to the left means that the image is dark, and it may be under-exposed. But, equally, that may be the look you were after.
Conversely, a histogram pushed to the right means the image is bright with lots of highlights and whites. Again, it may be over-exposed, unless you were aiming for a high-key image.
A lot of photos you shoot will have a smooth bell curve with few blacks, and whites and the majority of the image sitting near the center of the histogram. Black and white photography often (not always) benefit from a strong separation between the different tones, so one will see two or more peaks in the histogram. The bigger the separation between these peaks, the greater the contrast.
But How Can the Histogram Help Me?
The main benefit of using the histogram is when you are shooting and want to check the exposure. Why? The screen on the back of the camera is not calibrated, and indeed photographers increase and decrease the brightness of those screens depending upon the ambient light. I turn the brightness down when shooting at night so as not to ruin my night vision and, on a sunny day, I make the screen as bright as possible, so I can read it. Consequently, you cannot use that screen as a guide to exposure.
Furthermore, your camera’s metering can be fooled into giving you incorrect exposure. In the evaluative/matrix/ESP metering mode (why can’t manufacturers standardize their nomenclature?), the camera will try to make the picture, on average, mid-gray in tone. So, if you are shooting a particularly bright scene, the camera will under-expose.
Some cameras are getting better at not being fooled in this way. Nevertheless, using the histogram helps you to decide whether to use exposure compensation.
I Cannot See My Histogram
With a mirrorless camera, you should see the histogram through the viewfinder (if your camera has one), in live view, or when playing images you have taken. With DSLRs the histogram is not visible through the viewfinder, and so only accessible in Live View or playback.
By default, the histogram is usually switched on, and you can display it by pressing a button on the camera body, but you may have to activate it in the menus first.
There are too many menu variations between manufacturers and camera models to list them all here, but if the following links should help you find how to switch your histograms on. Or, you should find your camera’s settings by Googling your camera make and model, and the word “histogram”.
The Histogram Isn’t the Same on the Computer
One thing you may notice, especially if you shoot raw, is that the histogram you see in your camera is not the same as the one you see when you upload it to your favorite editing program. The reason being is that these programs generate their own unique preview of the raw file. The applied default settings are, consequently, different from the ones added by your camera, which is embedded in the raw file. In fact, if you have an array of editing suites on your computer, you may find that the default histogram for the same photo is different in every one of them.
Two Types of Histogram
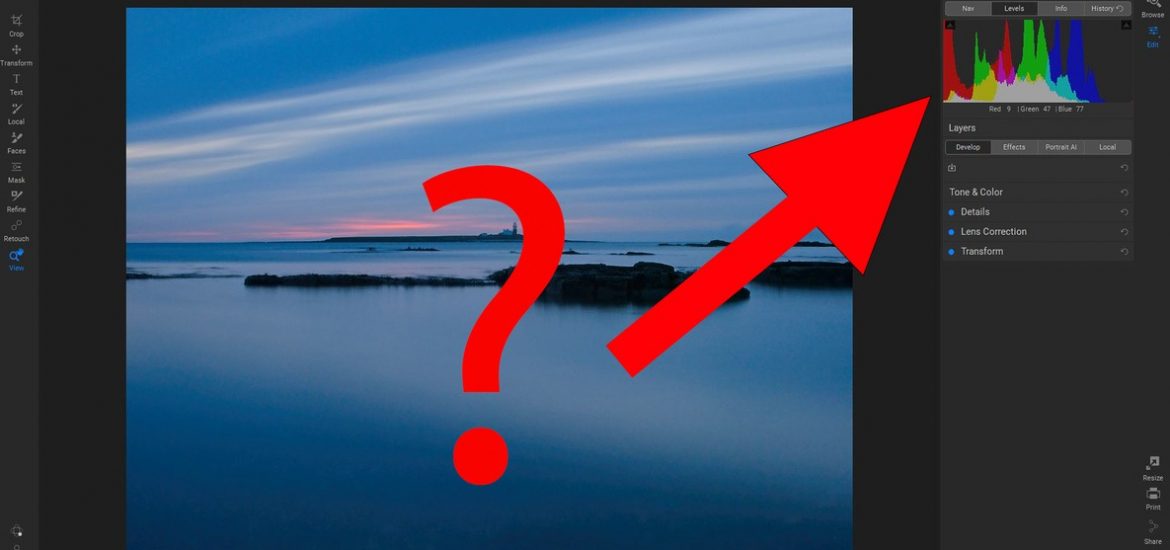
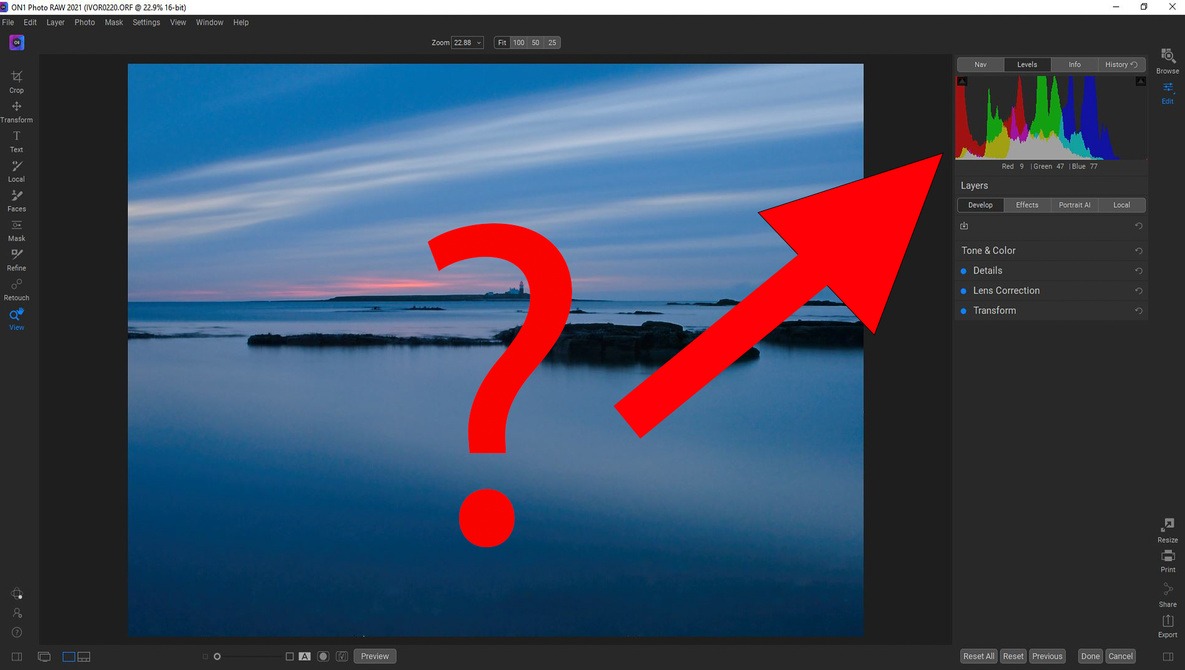
You will notice that there are two types of histogram available to you. The first includes colors, and so you can see the luminance of the Red, Green, and Blue Channels. The second is simpler, just showing the overall brightness of the entire image. For most types of photography, the latter has all the information we need.
It’s Not the Only Tool in the Box
Your camera will also have highlights and shadows warnings. Sometimes called zebras, these show pure whites and pure blacks as a flashing colored overlay in your image. Most photographers want to avoid blown highlights, as they are irrecoverable in developing. Similarly, black areas in the photo can also lose their details.
These warnings are available in most raw developing tools too. Look for the little triangles in the top right and left of the histogram in Lightroom and On1, or the “show clipped shadows” and “show clipped highlights” buttons in Affinity. Capture One doesn’t have this feature, and if you are familiar with the histogram, and if your screen is calibrated, it may not be necessary on a computer.
Something To Try
Open a photo in your editing software and look at its histogram. Slide the exposure up and down and see what happens to it as the image gets brighter and darker. Next, try the contrast slider. Increase the contrast to maximum and not how the histogram is stretched. Then decrease the contrast and watch the histogram get pushed together. Try the other sliders too, to see how they affect the image and the histogram.
I hope you enjoyed this brief introduction to histograms. Please let me know if you have yours switched on in your camera, and feel free to ask questions, and I’ll try to answer them.